Funding Pensions
by P
Barber 20 June
2010
Synopsis
1. This paper argues that an adequate fund growth rate is an essential
requirement for the provision of sustainable pensions.
Back Ground
2. The principal behind a pension scheme is that donations are deposited
in a fund during ones working life, and that the combination of these deposits
builds up a fund which is then sufficient to provide an adequate income during
retirement. The critical elements of this process are:
a) the magnitude of the payments deposited in the fund
b) the timing of those deposits
c) the rate of fund growth
d) the rate of inflation
e) the number of years over which the fund is built up
f) the number of
retirement-years that are to be provided
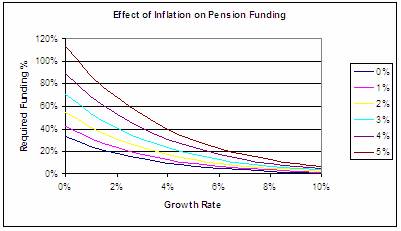
Funding if Growth and Inflation are assumed to be zero
3. If both fund growth and the rate of inflation are
assumed to be zero, then funding becomes a function of:
a) the number of years over which the fund is built up
b) the number of years over which a pension is drawn
4. This process is demonstrated in the diagram below.
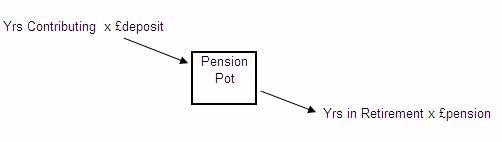
5. In the simplified example above it is assumed that
deposits are made in equal amounts throughout the working years and that a fixed
pension is paid for all the years is retirement. It is assumed that the “Pension
Pot” built-up during the working life is the same as the money required to fund
the pension payments.
6. If we now examine this model in terms of Income
percentages the results can be quite alarming. Given that:
a) £deposit = Income x Funding %
b) £pension = Income x Pension Rate%
7. The above process can be defined in terms of the
equation shown below:
Yrs Contributing x Income x
Funding % =
Pension Yrs x
Income x Pension %
8. The pre-1997 standard for a final salary pension fund
was 2/3rds of final pension (i.e. Pension % = 66%), based on forty years
service
9. If the equation above is manipulated and this target
Pension % applied, then the required level of funding can be determined.
Funding % = ( Pension Yrs x Income x 66% ) / Yrs
Contributing x Income
10. Historically a man would have paid into a pension fund
for 40 years, and then drawn a pension for 20 years. Since Income appears both
in the top and bottoms parts of the equation, the required funding % would
be:
Funding % = 20 years x 66\% / 40
years = 33%
11. Needless to say nobody, reaching the age of retirement
today, has funded their pension-pot at a rate of 33% of Income consistently for
the last 40 years. It should be of little surprise therefore that Companies which
still offer final salary schemes are struggling to meet their obligations and
people who are in defined contribution schemes are finding that the pensions at
retirement are an insignificant fraction of the sum they were expecting to
receive when they signed up to join the scheme.
So what went wrong?
12. The key to understanding what went wrong with pension
funding lies with an understanding of the way in which a pension-pot accumulates
interest and dividends on its invested deposits, in addition to the normal
pension-fund contributions. The table below provides an example of the process,
although it should be noted that the process illustrated is quite crude in the
way interest and dividends are calculated, and it also assumes that a single
pension payment of £3,000 is made at the beginning of the year. The process
operates as follows:
i)
in the first year a payment of £3,000 is made into the
fund, this is shown in column b)
ii)
the closing funds, shown in column c) are calculated by
summing the opening balance and the payment into the fund, (£0 + £3,000 =
£3,000)
iii)
at the end of the year interest and dividend is
calculated (in
this case calculated as 10% of the value of the fund) this is shown in column
d)
iv)
the opening funds at the beginning of the second year are
shown in column a), they are calculated by adding the closing balance for the
previous year and the interest and dividends earned in the previous year.
(£3,000 + £300 = £3,300)
|
|
|
Assumed
Growth Rate
= |
10.0% | |
|
|
|
|
|
|
|
|
a) |
b) |
c) |
d) |
|
|
|
|
|
Interest |
|
|
Opening |
payment |
Closing |
&
Dividends |
|
Year |
Funds |
into
fund |
Funds |
earned |
|
1 |
0 |
3,000 |
3,000 |
300 |
|
2 |
3,300 |
3,000 |
6,300 |
630 |
|
3 |
6,930 |
3,000 |
9,930 |
993 |
|
4 |
10,923 |
3,000 |
13,923 |
1,392 |
|
5 |
15,315 |
3,000 |
18,315 |
1,832 |
|
6 |
20,147 |
3,000 |
23,147 |
2,315 |
|
7 |
25,462 |
3,000 |
28,462 |
2,846 |
|
8 |
31,308 |
3,000 |
34,308 |
3,431 |
|
9 |
37,738 |
3,000 |
40,738 |
4,074 |
|
10 |
44,812 |
3,000 |
47,812 |
4,781 |
|
11 |
52,594 |
3,000 |
55,594 |
5,559 |
|
12 |
61,153 |
3,000 |
64,153 |
6,415 |
|
13 |
70,568 |
3,000 |
73,568 |
7,357 |
|
14 |
80,925 |
3,000 |
83,925 |
8,392 |
|
15 |
92,317 |
3,000 |
95,317 |
9,532 |
|
16 |
104,849 |
|
|
|
|
|
|
|
|
|
|
By year
15 we have: |
45,000 |
|
59,849 | |
13. It can be seen that in the table above, by the
beginning of year 16 the funds have built-up to £104,849: of this balance
£45,000 has derived from payments into the fund, while £59,849 has derived from
interest and dividend receipts. It should also be noted that by the end of year
15 the value of interest and dividend payments received at £9,532 is more than
three times greater than the £3,000 contributed to the fund.
14. It is this process of accumulating interest and
dividend payments which was historically the essence of pension scheme funding.
If the above arrangement was to operate for a period of 40 years, then at the
end of the period the value of the fund would be £1,460,555. Which, at a 10%
yield rate would return an income of £146,055 indefinitely; no worries about
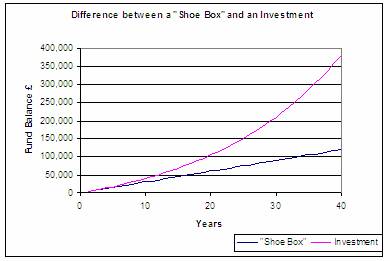
living a few years longer with this model. Working the numbers backwards, if the
pension represented 2/3rds of final salary then the final salary would have been
£219,082 (£146,055 x 3 / 2 = £219,082) and the pension contribution rate would
have been 1.36% (£3000/£210,082 = 1.36%). The difference between a fund, which
merely operates as “a shoe box under the bed”, and one which is invested, and
earns a return on the deposits made is illustrated in the graph below.
15. Leaving aside the issue of the “village economy” and as
to whether or not there are sufficient investment opportunities in the “village”
to accommodate this level “collective pension-pot”, the main problem with this
process has been that the interest and dividend rates have been nothing like 10%
over the accumulation period.
Sensitivity to interest and dividend rate
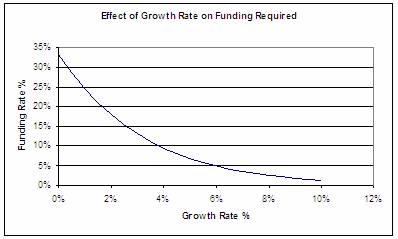
16. The (OVER OPTIMISTIC)
graph below illustrates the relationship between fund growth and the theoretical
level of funding. The figures behind the graph assume that the “Pension-Pot”
attracts the growth rate of interest for the whole of its life of 60 years that
is 40 years paying into the fund followed by forty years drawing a pension of
2/3rds of income. These figures do not take account of inflation and assumes
that income remains constant for the whole of ones working life and that the
“Pension Pot” is empty at the end of the 20 year pay-out period. In short,
the picture created in the graph below is far too rosy.
17. It is perhaps worth
referring to the impact of Chancellor Brown’s 1997, and each year since,
£5.3Billion raid on pension funds at this point. The 1997 change imposed
Corporation Tax on the payment of dividends into pension funds and for a pension
funds predominantly invested in
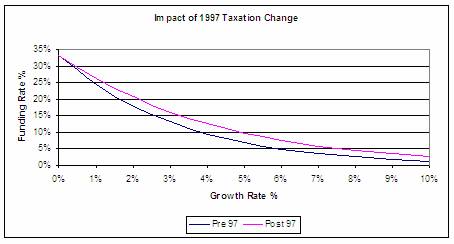
18. With reference to the
data contained in the graph above; if prior to the 1997 taxation change a 2/3rds
pension would be achieved if a pension fund had been funded at a rate of 9.5% of
Income with a 4% Growth Rate. Following the taxation changes it would have been
necessary to increase funding to 12.7% of Income, an increase of 3.2%, in order
to maintain the same level of Pension.
Effect of Inflation
19. The effect of
inflation is illustrated in the table and graphs shown below. As can be seen
from the table with a zero rate of growth and a 5% inflation rate, it would be
necessary to contribute 113% of income for a period of 40 yrs in order to fund
an inflation-proof (5%) for a period of 20 years. This is obviously not
possible.
|
PENSION FUNDING TO ACHIEVE 2/3rds FINAL SALARY
PENSION | ||||||
|
|
|
|
|
|
|
|
|
Growth |
I n f l a
t I o n R a t e | |||||
|
Rate |
0% |
1% |
2% |
3% |
4% |
5% |
|
0% |
33.3% |
41.8% |
54.6% |
70.3% |
89.6% |
113.0% |
|
1% |
24.6% |
31.4% |
41.3% |
53.8% |
69.1% |
87.9% |
|
2% |
18.0% |
23.3% |
31.0% |
40.8% |
53.0% |
68.0% |
|
3% |
13.2% |
17.2% |
23.2% |
30.7% |
40.3% |
52.2% |
|
4% |
9.5% |
12.7% |
17.2% |
23.0% |
30.4% |
39.8% |
|
5% |
6.9% |
9.2% |
12.6% |
17.1% |
22.9% |
30.2% |
|
6% |
4.9% |
6.7% |
9.3% |
12.6% |
17.0% |
22.7% |
|
7% |
3.5% |
4.9% |
6.8% |
9.3% |
12.6% |
17.0% |
|
8% |
2.5% |
3.5% |
4.9% |
6.8% |
9.3% |
12.6% |
|
9% |
1.8% |
2.5% |
3.5% |
4.9% |
6.8% |
9.3% |
|
10% |
1.3% |
1.8% |
2.6% |
3.6% |
5.0% |
6.9% |
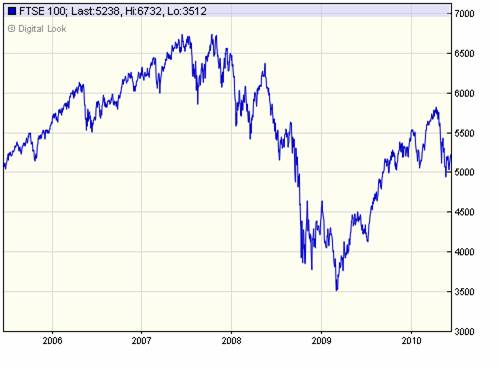
20. The conclusion to be
drawn from this table is that at current rates of growth (June 2010 with NatWest
deposit interest rates at 0.11%, Dividends at 4.13%, Increase in the value of
Stock Investments at 0% (see 5 year FTSE 100 Chart below – taken from
moneyweek.com web-site)) of 4% at best and inflation at 3% pension funding needs
to be at 23% of Income.
Conclusion
21. The conclusion from
the above is clearly that the adequacy of pension funding is dependant upon the
adequacy of the fund growth rate, and low rates of inflation. Life span is am
important element, but if growth rate was sufficient then the interest earned on
the “pension-pot” would be sufficient to meet all eventualities. The imposition
of dividend tax has had a significant effect on the pension process, resulting
in the system being unsustainable.
22. In assessing the
effect of Chancellor Brown’s 1997 pensions grab, the effect can be viewed
as:
- Reducing the income flowing from a “Pension-Pot” by 28%
- Necessitating a 39% increase in the size of the
“Pension-Pot” required to support the desired 2/3rds pension.
- Companies with defined benefits pension schemes are
forced to increase the funding to their schemes, resulting in the payment of
lower dividends, and
- A reduction in stock-market investment values.
- People with defined contribution-pensions are severely
impacted, as
- their capital base is lost as the value of the shares
which underpin their “Pension-Pot” declines, under the weight of defined
benefit schemes,
- growth rates are at least 28% lower than anticipated,
- their pension pot needs to be 39% higher than
anticipated,
- there is no way in which they can make personal
contributions out of earned income which would enable them to bridge this gap,
and the employers are under no obligation to make-good any shortfalls.